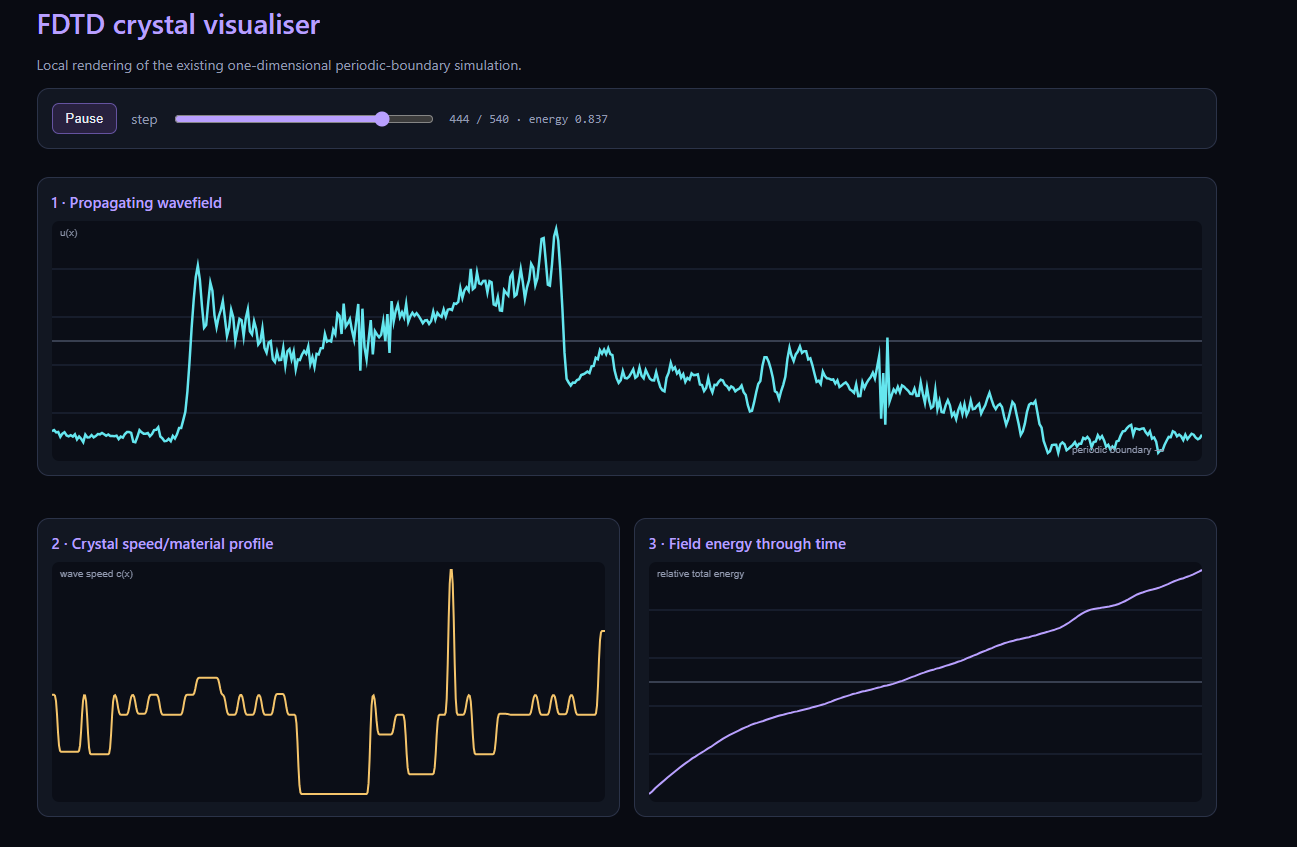
Today we got the FDTD energy visualiser running in the browser. It is a small but satisfying step: the simulation has a visible home now, with the wavefield, material profile, energy trace, and a few ways to watch the state change.
Nothing too grand to report—just a working visual window, a screenshot worth saving, and one more part of the project moving from an idea into something we can actually look at.